Lindsey E. Wylie, J.D., Ph.D.
Adult at 18. Senior at 65. High risk, moderate, or low. The law treats these bright lines like laws of nature. Every line misses the ones in between. I tell their stories with data.
The Premise

I study how the legal system measures people: how it decides who counts as an adult, who is high-risk, who is competent, and what follows when those measurement choices are treated as settled facts. Much of my work concerns the unintended consequences of well-intentioned rules, and the distance between what a policy is meant to do and what it does.
My interests are shaped by my experience as a system-involved young person and my desire to highlight under-studied research topics.
Before joining the National Center for State Courts, I directed research at the University of Nebraska Omaha's Juvenile Justice Institute. I have led federally funded research projects and multi-state evaluations across topics in pretrial and diversion, behavioral health in courts, and family violence.
Start Here
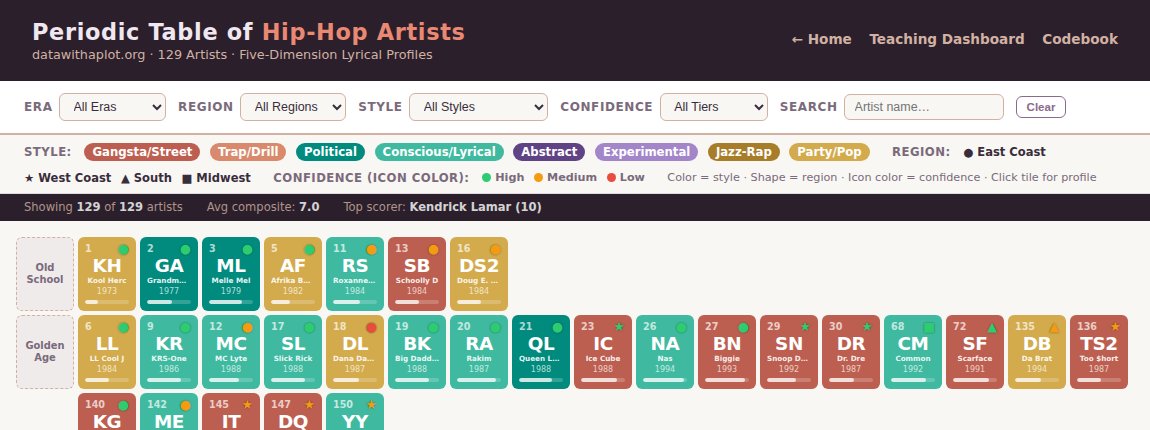
A dataset of 187 hip-hop acts, built to teach what goes into a score and what can quietly bend it, using a subject people genuinely argue about.
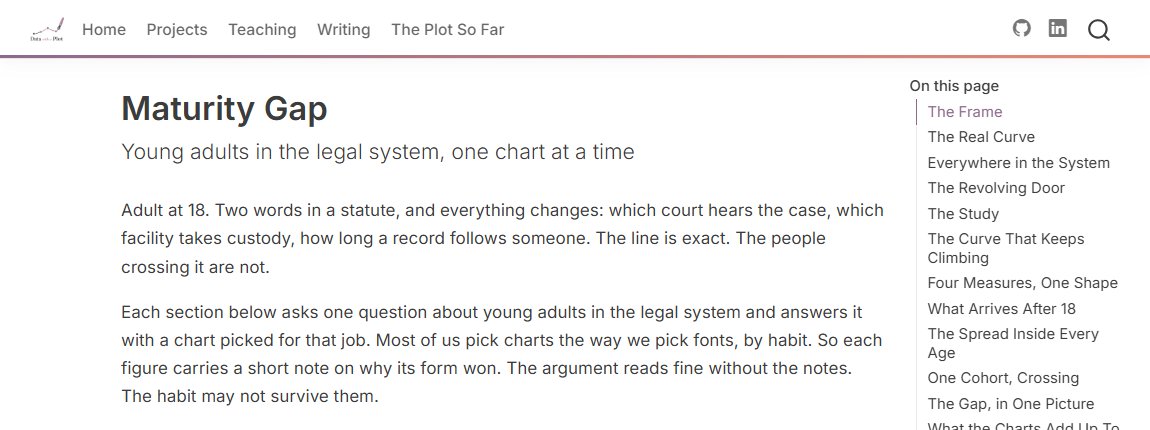
Young adults, the legal system, and the data between them: federal arrest, prison, and recidivism numbers, then a study that measured the same 1,354 people growing up, with a note under every figure on why that chart form got the job.
Built with Quarto · Hosted on GitHub Pages
n = 1 website. Results may not generalize.