Education
Teaching
Each exercise asks for a quick judgment and then shows what shaped it; the planning tools work through an evaluation or report of your own.
More in Cultivating a Court's Data STORY, Trends in State Courts, 2025. Presented at the National Association for Court Management.
Warm-Ups
Each starts with a quick call about something familiar, such as a favorite rapper or the age at which someone becomes old, and then takes apart what went into it.
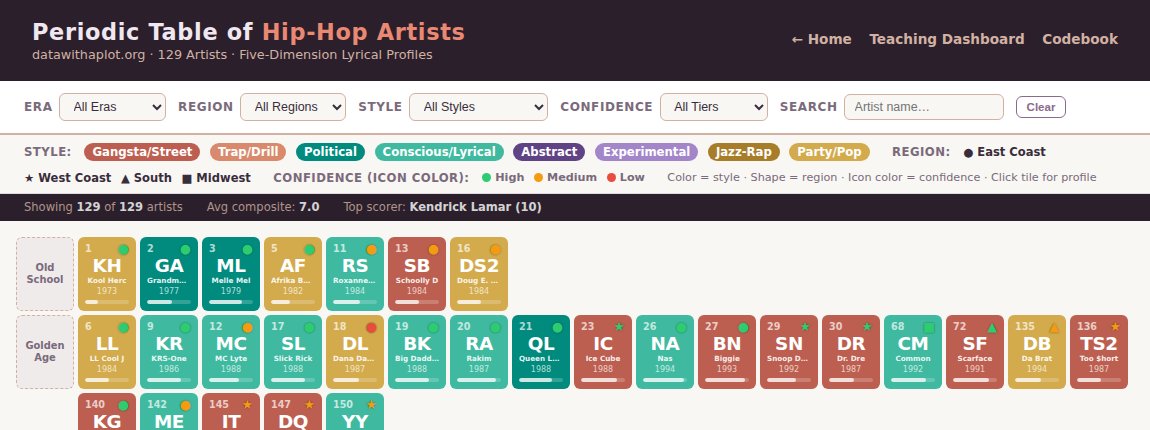
The Hip-Hop Periodic Table
Score a favorite rapper on gut feeling, then compare that score with a table of 187 hip-hop acts rated on five parts of lyricism, and see how much depends on what you decided to measure.
Explore the periodic table →Companion materials: analytics dashboard · data dictionary
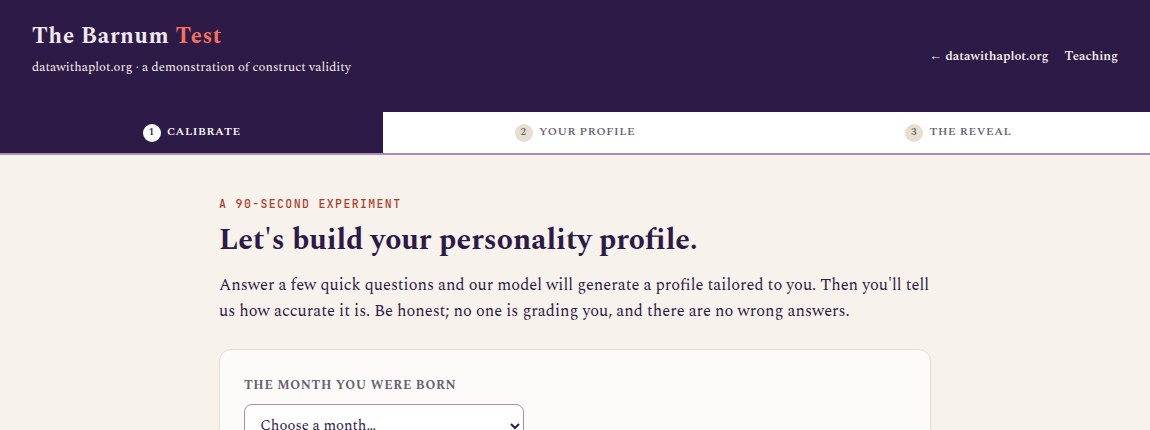
The Barnum Test
A short personality profile that almost everyone rates as accurate, which is exactly the problem it is built to show.
Take the Barnum Test →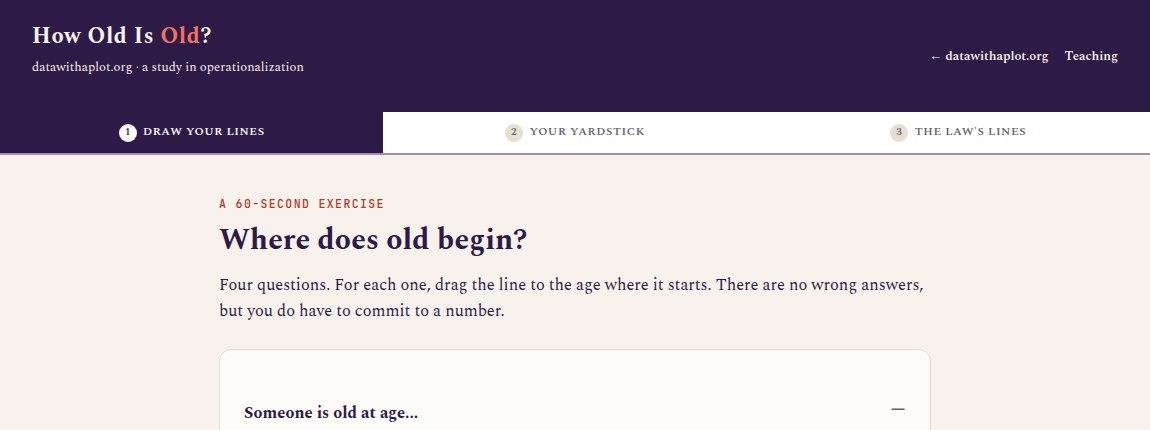
How Old Is Old?
Set the age at which someone becomes old, a senior, or too old to drive, then see how far apart your own lines sit and where the law draws the same lines.
Try How Old Is Old? →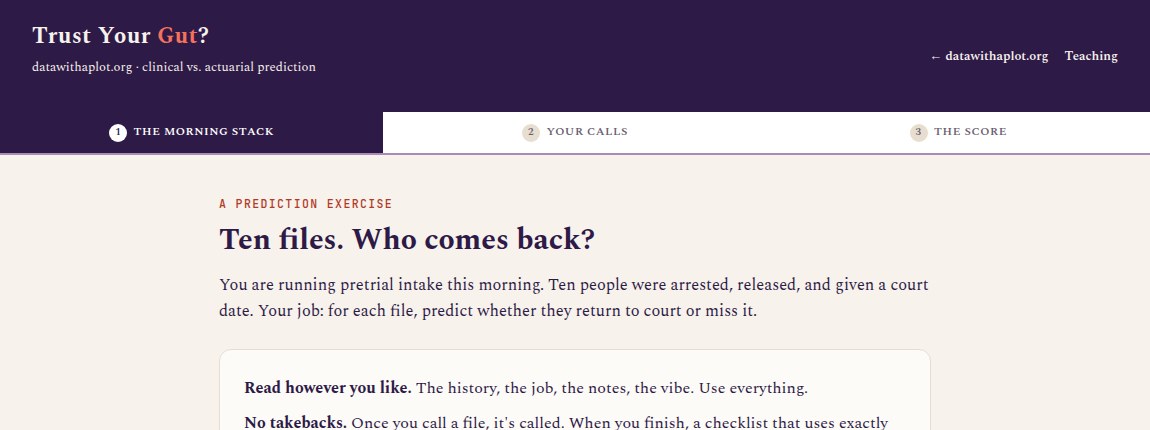
Trust Your Gut?
Read ten case files, predict who returns to court, and then see your calls scored against a checklist that uses exactly two facts.
Trust your gut? →The STORY Framework
These tools follow the STORY framework from my Trends chapter (Strategy, Target audience, Observations, Representations, Yield); the evaluation picker comes first because a story needs findings before it can be told.
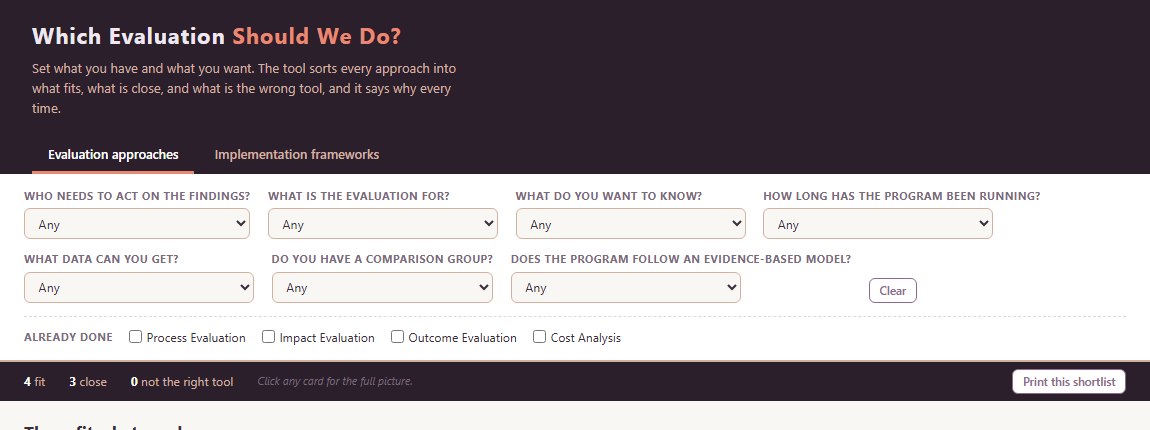
Which Evaluation Should We Do?
Answer up to seven questions about your program, and every evaluation approach sorts into what fits, what is ruled out, and what could fit with more time or data.
Open the evaluation picker →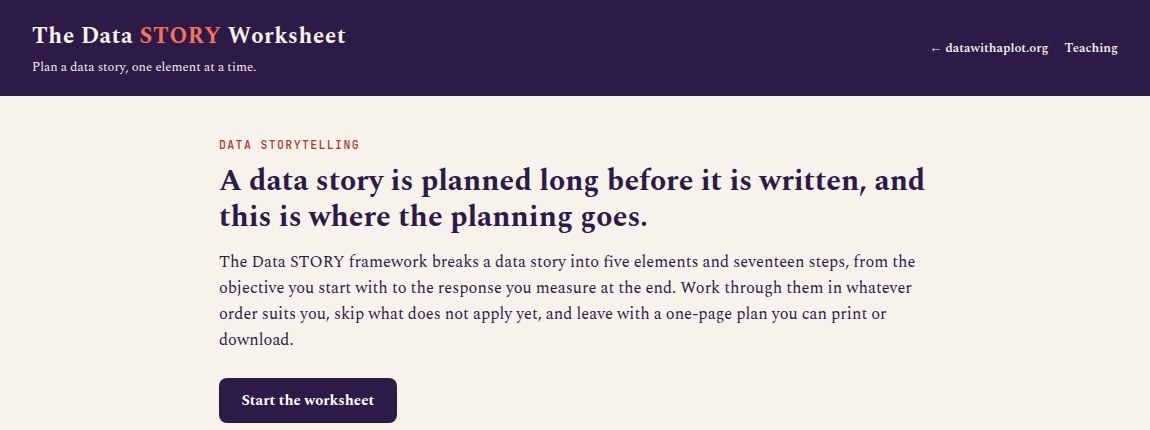
The Data STORY Worksheet
The five elements of a data story, strategy through yield, laid out as seventeen steps you can fill in, with a one-page plan to print or download at the end. It will not write the story for you, but it will show you which parts you have not thought through yet.
Open the worksheet →Companion tool: format picker (which deliverable fits)
The Usual Subjects
Measurement and metrics: building performance measures that hold up, and knowing when a composite score helps and when it misleads.
Data visualization: choosing the chart that matches your argument, and showing uncertainty instead of false precision.
Program evaluation: matching the evaluation to the question and the program’s stage, and knowing what must be in place before outcomes mean anything.
Data storytelling: turning findings into a story a specific audience can act on, with a narrator they trust and a call to action you can measure.